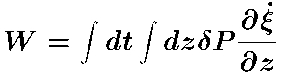
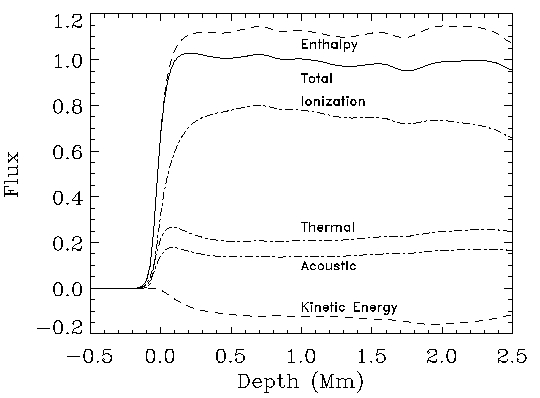
Integrate the conservation laws: mass, momentum and energy, but not in
conservative form:
- Depth of the convection zone (helioseismology)
The convection zone depth is directly influenced
by
-
 The Equation of State
in the
CZ
The Equation of State
in the
CZ
-
The entropy jump near
the surface
-
Spectral line blocking
- about 12% for the Sun
(would increase
Teff by 3% for T4 source function)
- sensitive to chemical abundances and (T,
P)
Changing Teff by +- 100 K alters CZ depth by +-7 Mm
- Mode Frequencies (helioseismology)
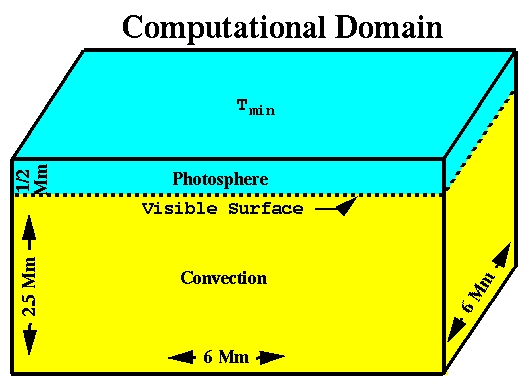
Standard, 1-D, Spherically Symmetric, Mixing Length Model
3D Convection Simulation + Mixing Length Envelope Extension
High frequency modes' cavity is enlarged by
- turbulent pressure support
(convergence to correct value ensured by line widths)
- 3D radiative transfer effects
Don't see hot gas.
Average temperature higher for a given effective
temperature
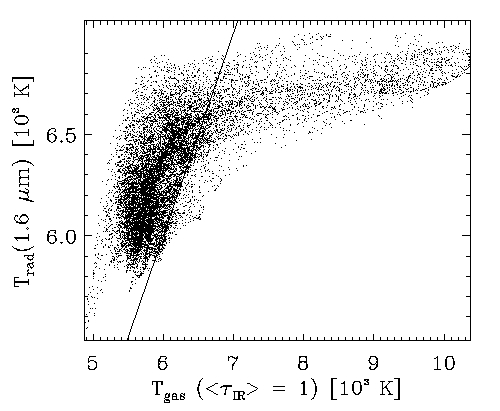
Contribute equally to elevating photosphere by 150 km.
High frequency modes' frequency is reduced.
Remaining discrepancies in mode frequencies can now be used to
investigate details of the mode physics.
- P-mode spectrum (helioseismology).
P-mode spectrum is asymmetric. Velocity power is larger toward
low frequencies and Intenstiy power is larger toward high
frequencies.
Intensity-Velocity phase jumps at modes.
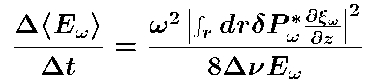
- P-mode excitation rate (helioseismology).
Stochastic, non-adiabatic, gas pressure fluctuations excite the
p-modes via PdV work,
Mode excitation rate is,
 Driving decreases at low frequencies
because the mode compression decreases and the mode mass
increases.
Driving decreases at low frequencies
because the mode compression decreases and the mode mass
increases.
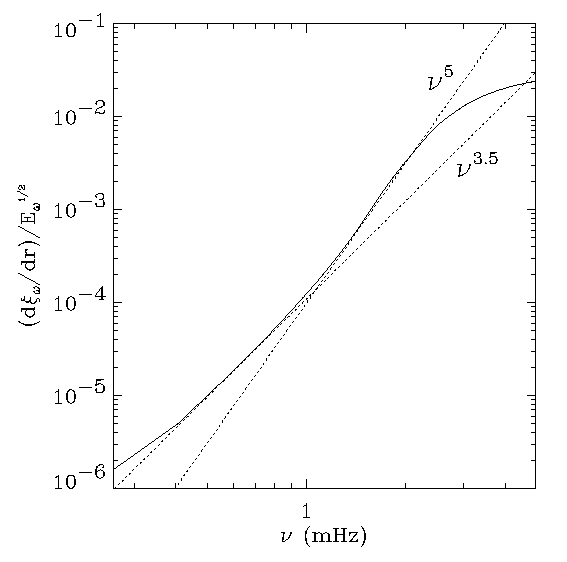
Driving decreases at high frequency
because the pressure fluctuations decrease.
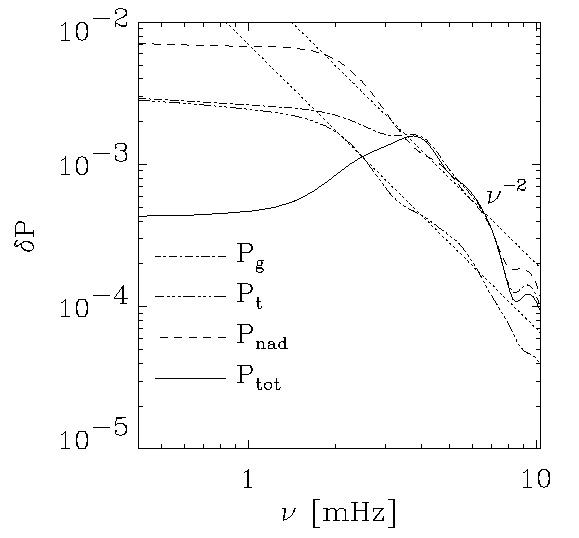
Driving is due primarily to turbulent pressure.
Non-adiabatic gas pressure fluctuations only are important at the
surface.
Driving occurs close to the surface.
The higher the frequency, the closer to the surface.
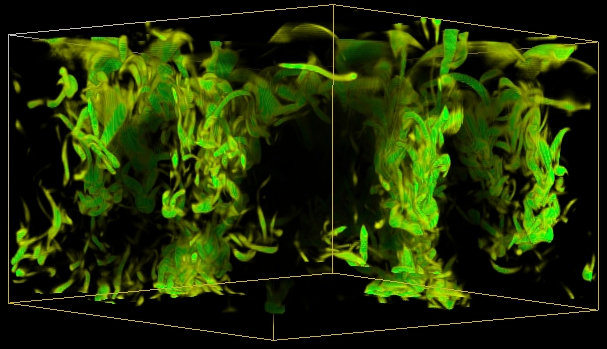
- Granulation (visible continuum).
Size Spectrum
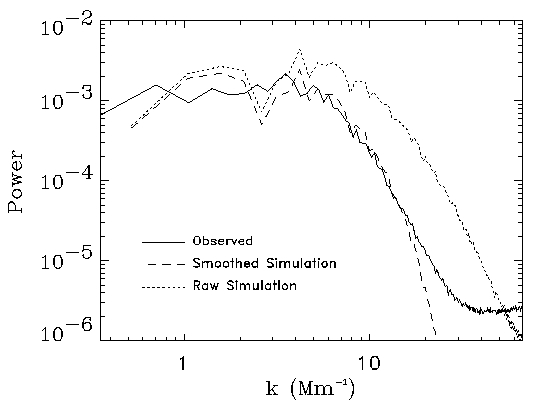
But beware: any image with sharp edged features (such as
 ) produces such a distribution.
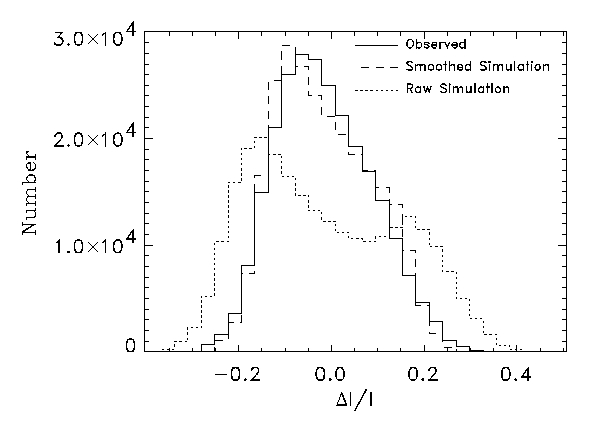
Emergent intensity distribution
(visible continuum).
- Photospheric line profiles (visible)
Line Formation: Fe I+II lines
- LTE (use majority species, weak lines)
- Accurate wavelengths and gf-values
- No free parameters (no micro-
or macroturbulence, damping enhancement, etc)
Line widths, shifts, and shapes provide constraints
- Width <->
flow velocity (thermal speed is small)
- Shift <->
temperature-velocity correlations
- Shape <->
details of convective overshoot, cf bisectors
Excellent agreement exists between simulated and
observed profiles of weak and intermediate strength FeI and FeII lines.
Without the convective and wave velocities, the line
profiles would differ drastically from the observed profiles:
Including velocities and sufficient resolution, produces close
agreement between simulated and observed profiles:
2D simulations do not give observed profiles
The average profile is a combination of profiles with very different
shifts, widths and shapes. (Thick red
line is average profile)
Line shapes depend on the details of the convection overshooting and
are revealed in the line bisectors.
Note: gravitational redshift is removed.
Sufficient resolution is necessary,
Small differences exist between synthetic and observed profiles for
strong FeI lines. These can be used to improve
the physics of the upper photosphere (and chromosphere).
 Agree with Observations
 Radiative Transfer crucial
 Diffusion - hyperviscosity
 Boundary Conditions
